ESPHome network monitoring
ESPHome is a popular system to control Espressif ESP8266 and ESP32 devices. This article describes how to monitor multiple devices using a custom ESPHome SNMP component and a popular network monitoring tool.
Thanks to that, you can detect and be informed about anomalous behaviors of your devices, like reboots, low Wi-Fi signal, or lack of free memory.
SNMP is supported by many applications, but this article discusses integration with the open source tool Zabbix. It is assumed you have Zabbix version 6.4 installed and running.
INFO
Zabbix installation guide is available on Zabbix web page: https://www.zabbix.com/download
SNMP Component
ESPHome doesn't support SNMP out of the box. But it provides a convenient way to integrate with external components.
To add SNMP protocol to ESPHome device reference SNMP Component located in https://github.com/aquaticus/esphome-snmp.
Add the following code to your ESPHome YAML configuration file:
yaml
# Enable SNMP component
snmp:

# Retrieve SNMP component from github
external_components:
   - source: github://aquaticus/esphome-snmp
When uploaded to a board you should see the following message in the log:
log
[00:00:00][C][snmp:268]: SNMP Config:
[00:00:00][C][snmp:269]:   Contact: ""
[00:00:00][C][snmp:270]:   Location: ""
Testing SNMP
Now you can try to retrieve some information from the board. There are plenty of programs that can browse SNMP data. Here are some examples:
Windows
- MIB Browser https://www.ireasoning.com/mibbrowser.shtml
- Paessler SNMP Monitor https://www.paessler.com/snmp_monitor
Linux
Here is a sample code to use on Linux. Replace IP address 192.168.1.10 to a value matching the address of your board.
bash
snmpget -v2c -c public 192.168.1.10 1.3.6.1.2.1.1.1.0The result of the above query looks like the one below. It is a description of the system. It is SMTP object sysDescr which translates to 1.3.6.1.2.1.1.1.0 object ID.
log
iso.3.6.1.2.1.1.1.0 = STRING: "ESPHome version 2023.3.2 compiled Mar 29 2023, 00:00:01, Board wemos_d1_mini32”Optionally you can try to get system uptime.
bash
snmpget -v2c -c public 192.168.1.10 1.3.6.1.2.1.25.1.1.0The result:
log
iso.3.6.1.2.1.25.1.1.0 = Timeticks: (66281) 0:11:02.81The time ticks value is changing continuously. Every call gives you different number.
For a list of all objects provided by SNMP component, see component documentation.
Templates
Download the template file from: https://github.com/aquaticus/esphome_zabbix_templates
It consists of 3 templates:
- Esphome by SNMP - base template
- Esphome ESP32 by SNMP - template for ESP32 devices (including C3, S2 and so on)
- Esphome ESP8266 by SNMP - template for ESP8266
The main difference between ESP8266 and ESP32 templates is heap data.
Import template file clicking Import button in Data collection→Templates.
Hosts
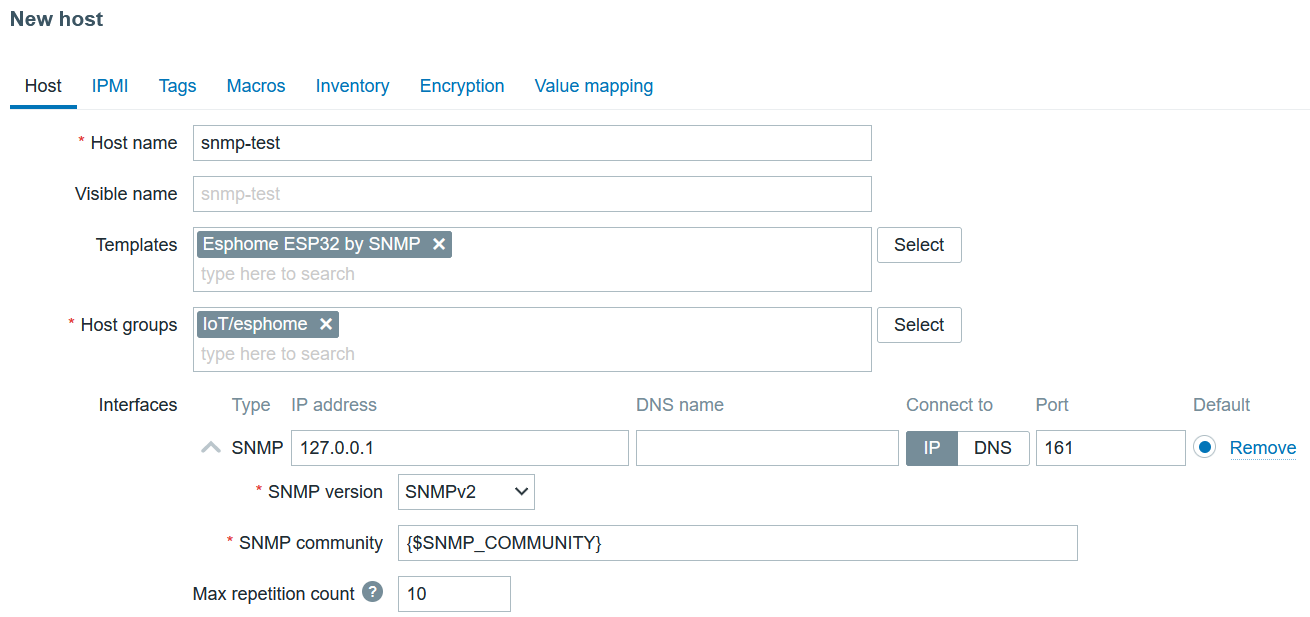
Open Zabbix interface and go to Monitoring→Hosts. Click Create host in the top right corner.
- As a template select Esphome ESP32 by SNMP or Esphome ESP8266 by SNMP
- Add
SNMPinterface. - Fill IP or DNS fields
- Leave the rest of the fields with default values.
- At the end click
Addbutton.
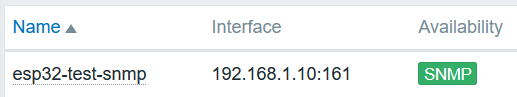
On the list of monitored hosts (Monitoring→Hosts) you should see a new entry.
There will be SNMP icon in the Availability column. Initially, it will be greyed but after a couple of seconds, it should turn green.
Monitoring
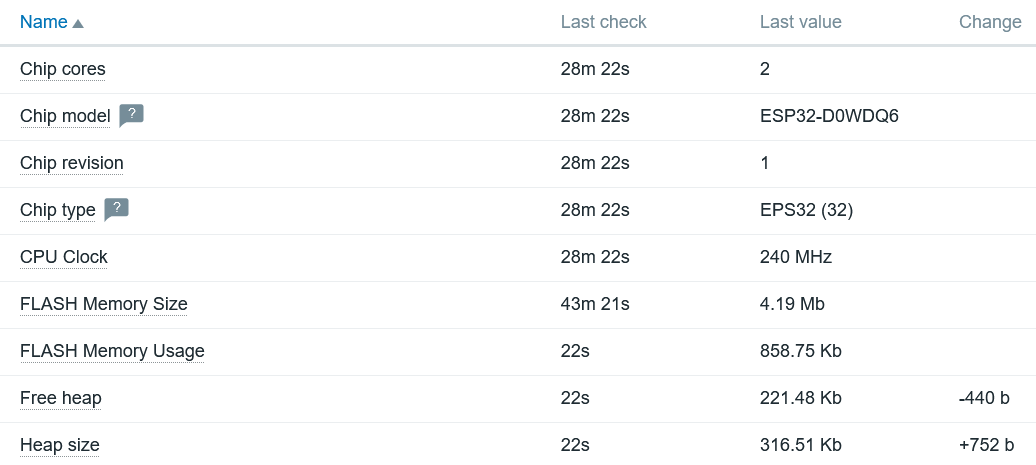
Once you see the green icon you can examine SNMP Data.
If you click on Latest data link you'll see the list of collected items.
Alarms
Zabbix can automatically detect anomalous situations. In Zabbix terminology, it is called "Trigger". ESPHome template ships with triggers that detects typical problems, for example, the board was reset. For a list of available triggers select Triggers from the menu when you click the host name.
Here is a default list of triggers:
- Firmware has changed
- High ICMP ping loss
- High ICMP ping response time
- Unavailable by ICMP ping
- The host has been restarted
- No SNMP data collection
- The system name has changed
- Weak WiFi Signal for 5m
- WiFi connection lost
You can also create your triggers, for example, to monitor heap usage.
Network uptime
SNMP Component can provide network uptime (SNMP object sysUpTime1.3.6.1.2.1.1.3). This parameter is crucial to detect connection loss events.
Unfortunately ESPHome WiFi component does not provide this information. Because of that by default SNMP Component reports always sysUpTime as 0.
To get meaningful data you must modify the original WiFi component and add one function.
You can do it manually or use the one already modified from the repository.
Manually modify WiFi component
Clone and install ESPHome from github.
Edit two files wifi_component.cpp and wifi_component.h in esphome/components/wifi directory.
In line 282 of wifi_component.h add two lines (it can be anywhere in public section):
cpp
#define WIFI_CONNECTED_TIMESTAMP_AVAILABLE
  uint32_t wifi_connected_timestamp() {return connected_timestamp_;}

 protected:
  uint32_t connected_timestamp_{0};
In wifi_component.cpp add in line 518 just before "WiFi Connected" log message:
cpp
this->connected_timestamp_ = millis();Test network uptime
Compile and upload new firmware.
Now when you read sysUpTime 1.3.6.1.2.1.1.3 object you should get different values every time get operation is performed.
bash
snmpget -v2c -c public 192.168.1.10 1.3.6.1.2.1.1.3.0You should see a value different than 0.
List of available OIDs
To see a full list of objects provided by ESPHome SNMP Component see OID list